Read account analytics
Use account analytics to understand the overall shape of your sales and customer activity.
Analytics should help you decide what to do next, not make you feel like you need to stare at charts all day. Start with the broad account view, then drill into products only when something changes or deserves attention.
A quiet account is not a problem; it just means the chart will be more useful after traffic starts. Once you launch, this page helps you notice growth, refunds, and product momentum.
Before you start
- Analytics become more useful after checkout activity begins.
Read the big picture
-
01
Start with the account-level numbers
Look at revenue, orders, customers, refunds, and delivery volume before you drill into one product. These numbers tell you whether anything needs a closer look.

-
02
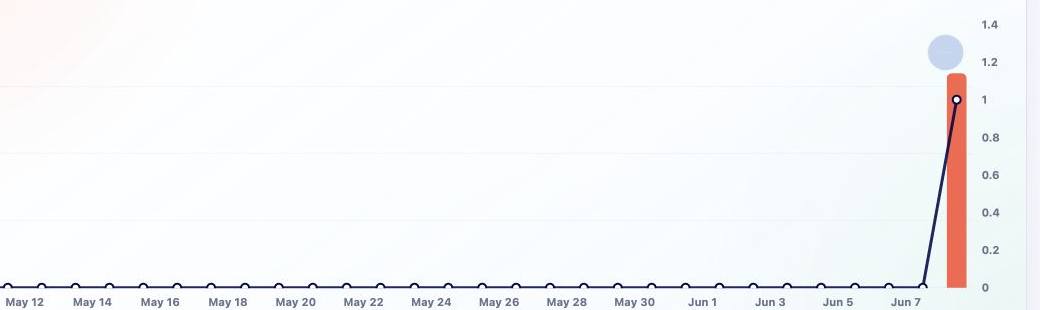
Use charts to spot trends
Charts help you see whether growth, refunds, or checkout activity changed over time. That is much better than reacting to a single order in isolation.
-
03
Drill into products when something moves
If account revenue rises or drops, open product analytics for the products most likely driving the change. The goal is to find the story behind the movement.
Good to know
- Account analytics are for broad direction. Product analytics are for product-specific diagnosis.